时间:2025-07-30 11:24
人气:
作者:admin
本文详细讨论一下thanos-sidecar
| 组件 | 版本 |
|---|---|
| 操作系统 | Ubuntu 22.04.4 LTS |
| docker | 24.0.7 |
| thanos | 0.36.1 |
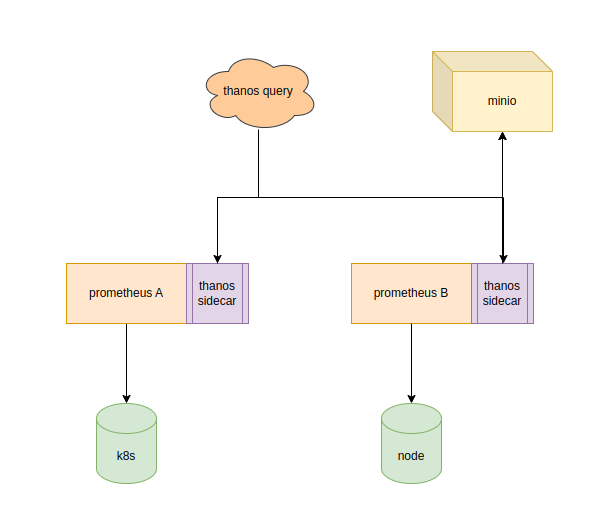
thanos主要有4个组件
Sidecar 与prometheus绑定在一起,负责处理与其绑定的prometheus各种监控数据的处理

加入重要的external label
apiVersion: v1
kind: ConfigMap
metadata:
  name: prometheus-cm
  labels:
    name: prometheus-cm
  namespace: prometheus
data:
  prometheus.yml: |-
    global:
      scrape_interval: 5s
      evaluation_interval: 5s

      # 新增外部标签
      external_labels:
        cluster: "prometheus-k8s"
      # 新增结束

    scrape_configs:
      - job_name: 'prometheus'
        static_configs:
        - targets: ['localhost:9090']

      - job_name: "prometheus-kube-state-metrics"
        static_configs:
          - targets: ["kube-state-metrics.kube-system:8080"]
加入thanos sidecar
apiVersion: apps/v1
kind: Deployment
metadata:
  name: prometheus-deploy
  namespace: prometheus
  labels:
    app: prometheus
spec:
  replicas: 1
  selector:
    matchLabels:
      app: prometheus
  template:
    metadata:
      labels:
        app: prometheus
    spec:
      containers:
        - name: prometheus
          image: registry.cn-beijing.aliyuncs.com/wilsonchai/prometheus:v2.54.1
          args:
            - "--storage.tsdb.retention.time=12h"
            - "--config.file=/etc/prometheus/prometheus.yml"
            - "--storage.tsdb.path=/prometheus/"
            - "--storage.tsdb.min-block-duration=30m"
            - "--storage.tsdb.max-block-duration=30m"
            - --web.enable-lifecycle
          ports:
            - containerPort: 9090
          resources:
            requests:
              cpu: 500m
              memory: 500M
            limits:
              cpu: 1
              memory: 1Gi
          volumeMounts:
            - name: prometheus-config
              mountPath: /etc/prometheus/
            - name: prometheus-data
              mountPath: /prometheus
        # 新增thanos-sidecar
        - name: thanos
          image: registry.cn-beijing.aliyuncs.com/wilsonchai/thanos:0.36.1
          args:
            - "sidecar"
            - "--prometheus.url=http://localhost:9090"
            - "--tsdb.path=/prometheus"
          volumeMounts:
            - name: prometheus-data
              mountPath: /prometheus
        # 新增结束
      volumes:
        - name: prometheus-config
          configMap:
            defaultMode: 420
            name: prometheus-cm
        - emptyDir: {}
          name: prometheus-data
apiVersion: v1
kind: Service
metadata:
  name: thanos-sidecar-service
  namespace: prometheus
spec:
  ports:
    - name: thanos-sidecar-port
      port: 10901
      protocol: TCP
      targetPort: 10901
  selector:
    app: prometheus
  type: NodePort
照葫芦画瓢,改造另一个prometheus,专门采集node监控数据的
docker run -d --net=host \
  --name thanos-query \
  registry.cn-beijing.aliyuncs.com/wilsonchai/thanos:0.36.1 \
  query \
    --http-address "0.0.0.0:39090" \
    --grpc-address "0.0.0.0:39091" \
    --store "192.168.49.2:30139" \
    --store "192.168.49.2:31165"
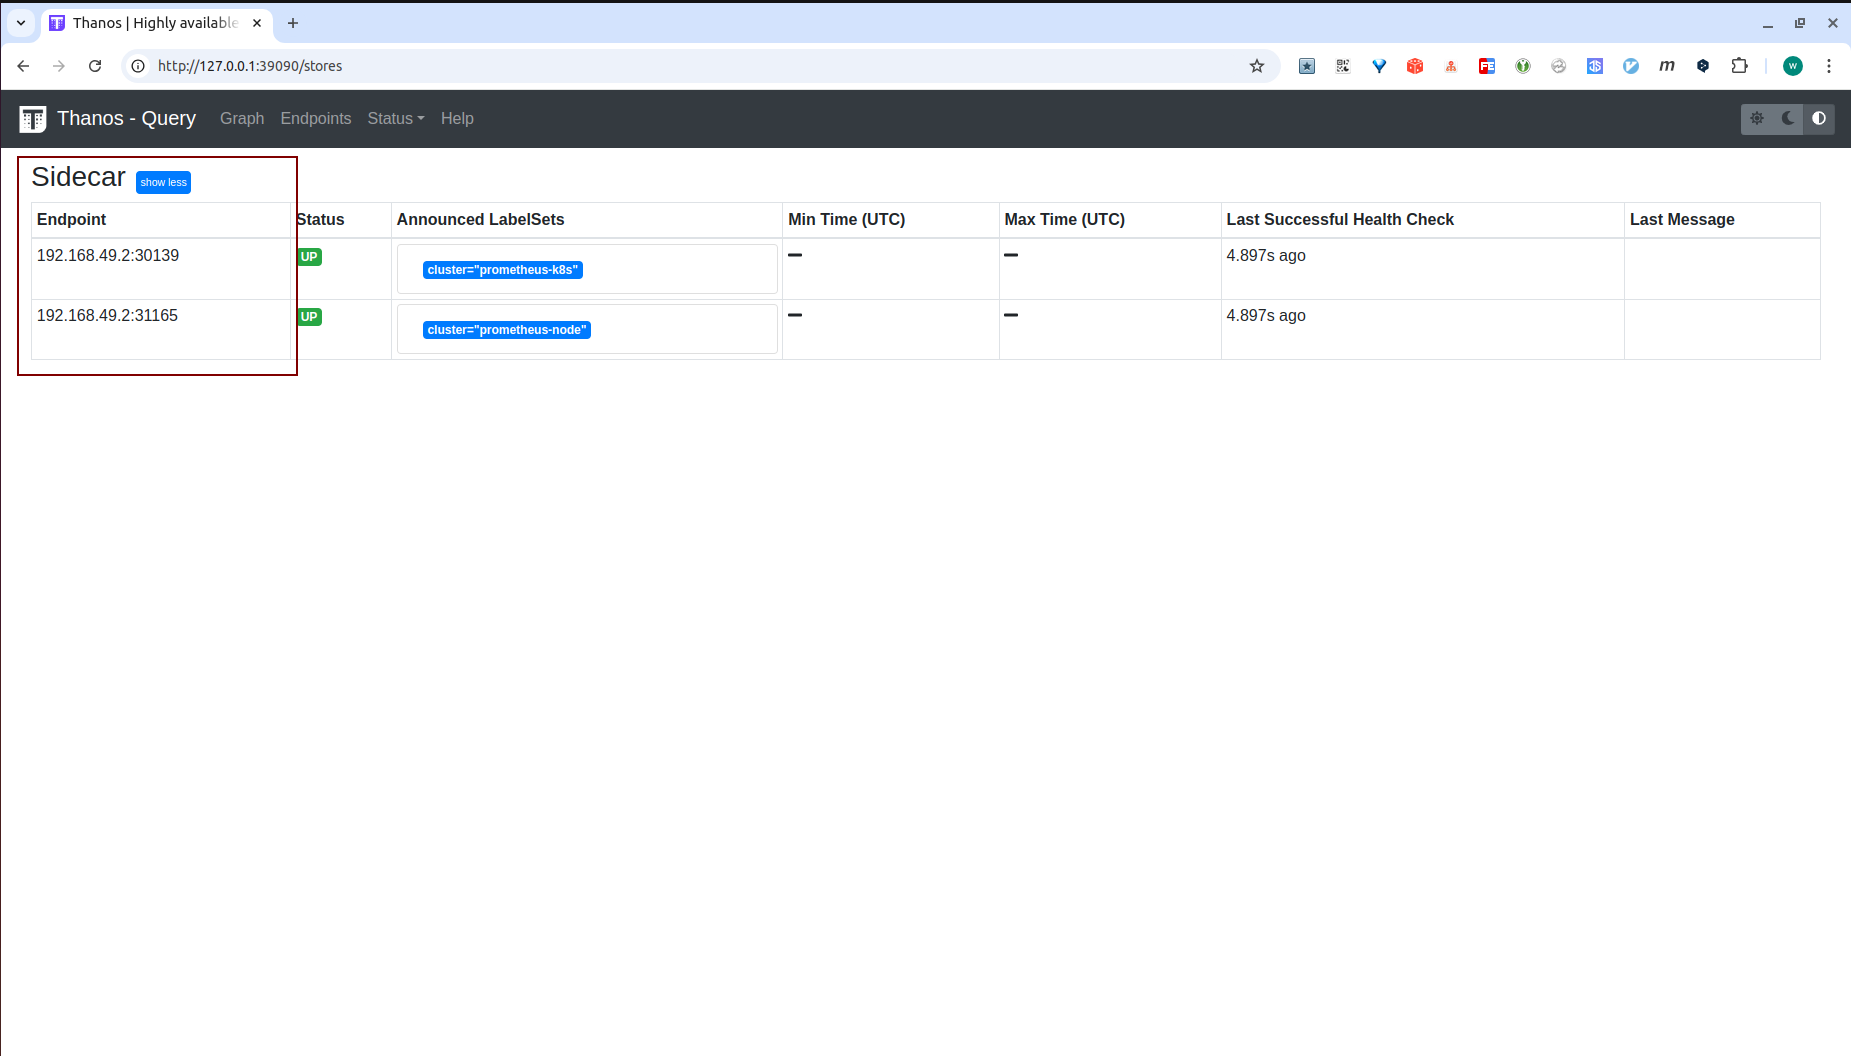
需要注意一下192.168.49.2:30139与192.168.49.2:31165,这里ip是thanos-sidecar所在pod的node ip,端口则是映射出来的nodeport
打开thanos-query页面检查
首先准备bucket.yml,由于thanos-sidecar在k8s里面,所以做成configmap
apiVersion: v1
kind: ConfigMap
metadata:
  name: bucket-cm
  labels:
    name: bucket-cm
  namespace: prometheus
data:
  bucket.yml: |-
    type: S3
    config:
      bucket: "wilson-test"
      endpoint: "10.22.11.156:9090"
      access_key: "zzUrkBzyqcCDXySsMLlS"
      secret_key: "nWCcztESnxnUZIKSKsELGEFdg6l6fjzhtqkARJB8"
      insecure: true
apiVersion: apps/v1
kind: Deployment
metadata:
  name: prometheus-deploy
  namespace: prometheus
  labels:
    app: prometheus
spec:
  replicas: 1
  selector:
    matchLabels:
      app: prometheus
  template:
    metadata:
      labels:
        app: prometheus
    spec:
      containers:
        - name: prometheus
          image: registry.cn-beijing.aliyuncs.com/wilsonchai/prometheus:v2.54.1
          args:
            - "--storage.tsdb.retention.time=12h"
            - "--config.file=/etc/prometheus/prometheus.yml"
            - "--storage.tsdb.path=/prometheus/"
            - "--storage.tsdb.min-block-duration=30m"
            - "--storage.tsdb.max-block-duration=30m"
            - --web.enable-lifecycle
          ports:
            - containerPort: 9090
          resources:
            requests:
              cpu: 500m
              memory: 500M
            limits:
              cpu: 1
              memory: 1Gi
          volumeMounts:
            - name: prometheus-config
              mountPath: /etc/prometheus/
            - name: prometheus-data
              mountPath: /prometheus
        - name: thanos
          image: registry.cn-beijing.aliyuncs.com/wilsonchai/thanos:0.36.1
          args:
            - "sidecar"
            - "--prometheus.url=http://localhost:9090"
            - "--tsdb.path=/prometheus"
            - "--objstore.config-file=/etc/thanos/bucket.yml"
          volumeMounts:
            - name: prometheus-data
              mountPath: /prometheus
            - name: bucket-config
              mountPath: /etc/thanos/
      volumes:
        - name: prometheus-config
          configMap:
            defaultMode: 420
            name: prometheus-cm
        - name: bucket-config
          configMap:
            defaultMode: 420
            name: bucket-cm
        - emptyDir: {}
          name: prometheus-data
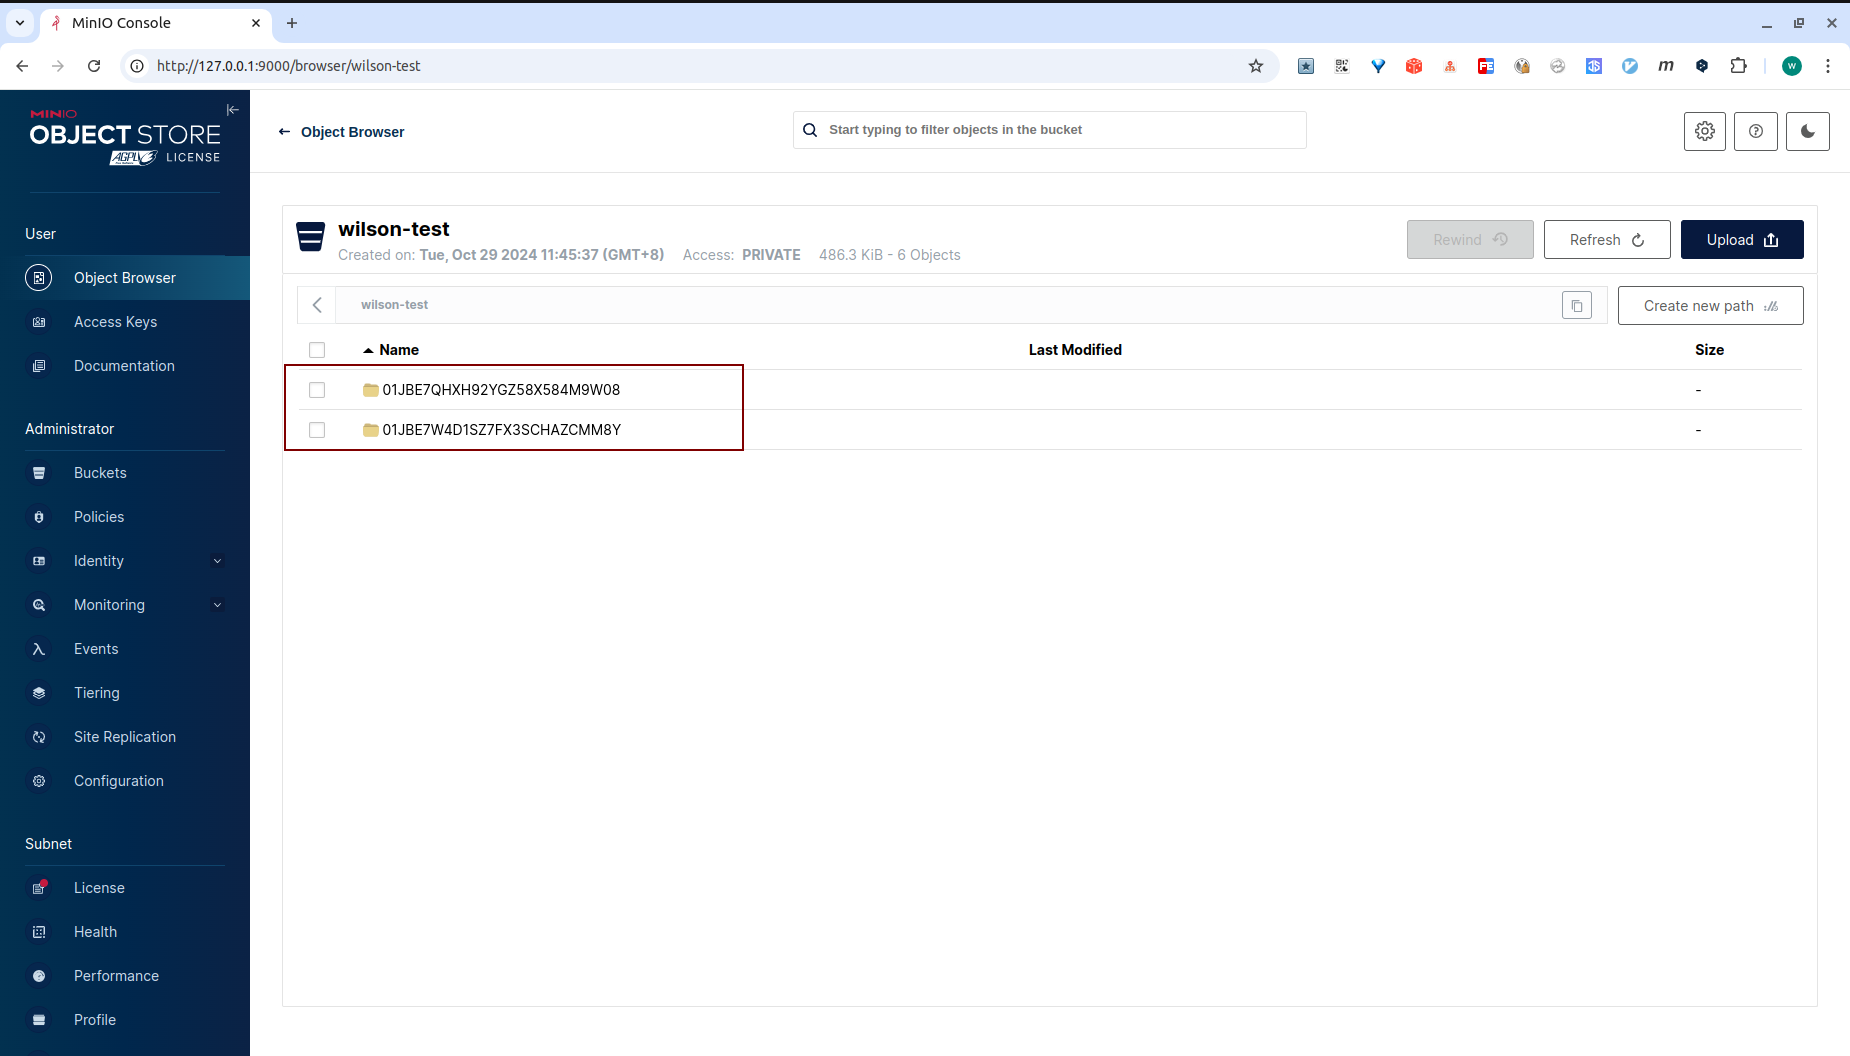
由于上传对象存储的时间是30m,所以我们先继续下面的步骤,一会回头过来再回来检查minio中是否有文件上传
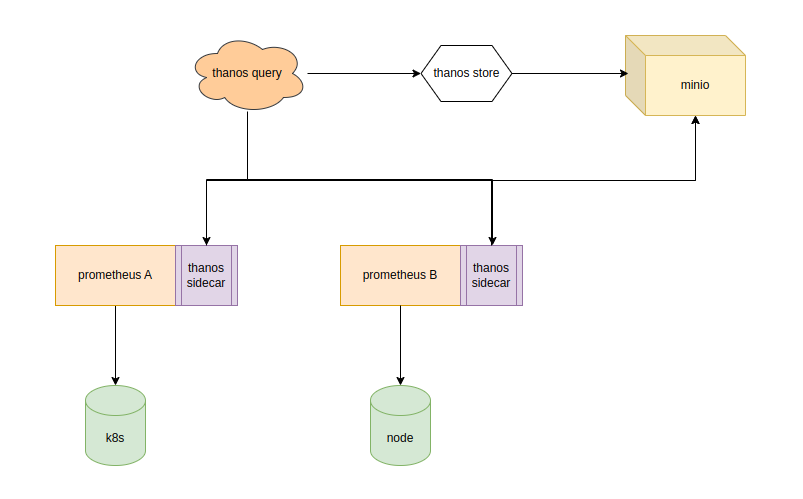
部署方式同receive
调整thanos-query的配置,新增thanos-store的地址
docker run -d --net=host \
  --name thanos-query \
  registry.cn-beijing.aliyuncs.com/wilsonchai/thanos:0.36.1 \
  query \
    --http-address "0.0.0.0:39090" \
    --grpc-address "0.0.0.0:39091" \
    --store "192.168.49.2:30139" \
    --store "192.168.49.2:31165" \
    --store "10.22.11.156:10901"
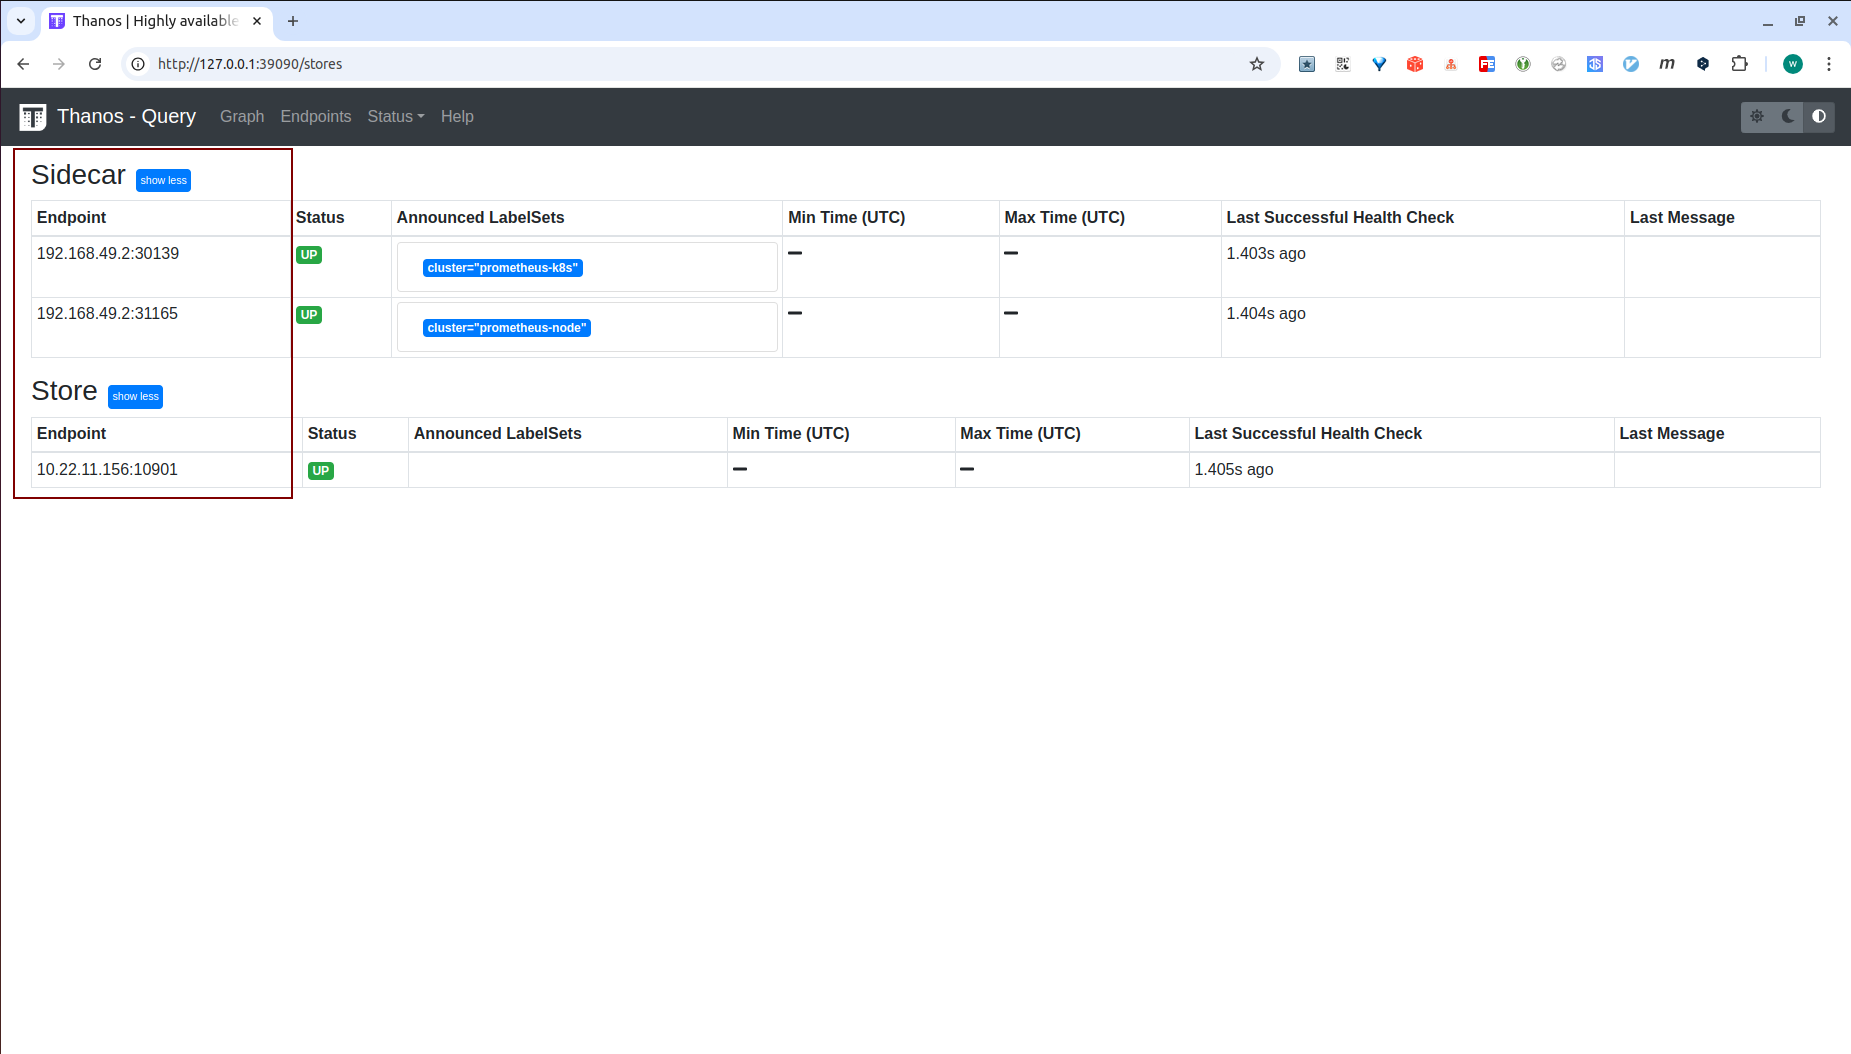
添加完毕后,检查thanos-query的web页面
万事俱备,回头去看看minio是否有文件上传,打开之后空空如也,怎么回事,去看一下thanos-sidecar的日志
▶ kubectl -n prometheus logs prometheus-deploy-6f8c5549b9-rqqk6 -c thanos
...
ts=2024-10-30T06:03:23.704299583Z caller=sidecar.go:410 level=warn err="upload 01JBDQNT0RZH4GFCFC564RWZT7: hard link block: hard link file chunks/000001: link /prometheus/01JBDQNT0RZH4GFCFC564RWZT7/chunks/000001 /prometheus/thanos/upload/01JBDQNT0RZH4GFCFC564RWZT7/chunks/000001: operation not permitted" uploaded=0
怎么回事?没有权限,冷静分析一下thanos-sidecar的上传逻辑
/prometheus,2个pod分别在该目录下创建的子目录或文件权限不一致,到此初步判断是 因为2个pod不同的启动用户导致权限有问题/prometheus证实/prometheus $ ls -lrt
total 44
-rw-r--r-- 1 nobody nobody 20001 Oct 30 02:46 queries.active
-rw-r--r-- 1 nobody nobody 0 Oct 30 02:46 lock
-rw-r--r-- 1 1001 root 37 Oct 30 03:31 thanos.shipper.json
drwxr-xr-x 3 nobody nobody 4096 Oct 30 03:31 01JBDQNT0RZH4GFCFC564RWZT7
/prometheus下,而thanos-sidecar会在/prometheus/thanos/下对源文件创建硬链接,先检查一下源文件/prometheus/01JBDQNT0RZH4GFCFC564RWZT7/chunks $ ls -lrt
total 96
-rw-r--r-- 1 nobody nobody 88911 Oct 30 03:31 000001
▶ id
uid=1000(wilson) gid=1000(wilson) groups=1000(wilson)

▶ touch /tmp/test

▶ sudo chown root.root /tmp/test

▶ sudo chmod 644 /tmp/test

▶ ln /tmp/test /tmp/ttttt
ln: failed to create hard link '/tmp/ttttt' => '/tmp/test': Operation not permitted
到此为止,问题已经比较明朗了,1个pod的2个container,使用了不同的启动用户,创建出来的文件是不同用户的权限,同时他们共享了同一个目录,而prometheus创建的数据文件是644的权限,没有三方写权限。而thanos-sidecar需要把prometheus创建的数据文件创建硬链接到自己的目录,由于没有写权限,创建硬链接失败
解决方案有很多种,这里给出最简单的一种,因为是部署在k8s中的1个pod,只需要指定同一个启动用户去启动不同container即可
apiVersion: apps/v1
kind: Deployment
metadata:
  labels:
    app: prometheus
  name: prometheus-deploy
  namespace: prometheus
spec:
...
  template:
...
    spec:
      securityContext:
        runAsUser: 555
      containers:
...
加入securityContext,并且随便指定一个用户id,这里我随便指定了一个555,重启之后再登录prometheus查看
问题解决
至此,本文结束
在下才疏学浅,有撒汤漏水的,请各位不吝赐教...
本文来自博客园,作者:it排球君,转载请注明原文链接:https://www.cnblogs.com/MrVolleyball/p/19011064
本文版权归作者和博客园共有,欢迎转载,但未经作者同意必须在文章页面给出原文连接,否则保留追究法律责任的权利。


 关注微信
关注微信