时间:2025-06-02 16:33
人气:
作者:admin
官网:https://prometheus.io/
GitHub地址:https://github.com/prometheus/prometheus
Prometheus 是由 Cloud Native Computing Foundation(CNCF) 孵化的开源监控与告警系统,专注于实时数据采集、存储和查询,广泛应用于云原生、容器化(如 Kubernetes)和微服务架构中。它以灵活的数据模型、强大的查询语言和生态扩展性著称,是现代 DevOps 和 SRE(站点可靠性工程)的核心工具之一。

Prometheus server 是 Prometheus服务器,用于抓取和存储时间序列数据。Prometheus server 由三个部分组成:Retrival,Storage,PromQL
作用:负责自动发现需要监控的目标。Prometheus 支持多种服务发现机制,包括:
流程:Service Discovery 模块找到目标后,将信息提供给 Prometheus Server,以便 Prometheus Server 能去相应目标拉取指标数据。
Exporters(数据采集器):是 Prometheus 与各种监控目标之间的桥梁。它们负责将不同系统和服务(如操作系统、数据库、中间件等)的指标数据转换为 Prometheus 可识别的格式。常见的 Exporters 有:
Jobs(作业):可以理解为一组相关的监控任务,每个 Job 可以包含一个或多个 Exporter 作为监控目标。Prometheus Server 会按照配置从这些 Jobs/Exporters 拉取指标数据。
对于一些短生命周期的任务(Short - lived jobs),由于其存在时间短,Prometheus Server 可能来不及拉取指标数据它们就结束了。Pushgateway 允许这些短生命周期任务主动推送指标数据到 Pushgateway,然后 Prometheus Server 再从 Pushgateway 拉取指标,确保数据不丢失。
Alertmanager 是一个独立的告警模块,从Prometheus server端接收到告警通知后,会进行去重、分组,并路由到相应的接收方,发出报警。
Alertmanager 负责处理 Prometheus Server 推送过来的告警信息。它可以对告警进行分组、抑制(避免重复告警)、沉默(在特定时间段内屏蔽告警)等操作,然后将处理后的告警通过多种渠道发送通知,如 PagerDuty、Email 等。
# 下载
[root@lb ~]# wget https://github.com/prometheus/prometheus/releases/download/v3.3.0/prometheus-3.3.0.linux-386.tar.gz
# 解压
[root@lb ~]# tar -xvf prometheus-3.3.0.linux-386.tar.gz
# 创建软链接
[root@lb ~]# ln -s /root/prometheus-3.3.0.linux-386 /root/prometheus
[root@lb ~]# ll /root/prometheus
lrwxrwxrwx 1 root root 32 Jun  2 16:06 /root/prometheus -> /root/prometheus-3.3.0.linux-386/
[root@lb ~]# vim /etc/systemd/system/prometheus-server.service
[Unit]
Description=huangSir Linux  Prometheus Server
Documentation=https://prometheus.io/docs/introduction/overview/
After=network.target

[Service]
Restart=on-failure
ExecStart=/root/prometheus/prometheus \
   # 指定配置文件
   --config.file=/root/prometheus/prometheus.yml \
   # 在指定数据的存储目录
   --storage.tsdb.path=/data/prometheus \
   # 日志级别,默认为info,支持debug, info, warn, error
   --log.level=warn \
   # 日志格式,这里指定为json,支持logfmt, json,默认值logfmt。
   --log.format=json \
   # 数据存储周期,支持y, w, d, h, m, s, ms。这里表示为60天
   --storage.tsdb.retention.time=60d \
   # 指定监听的主机和端口,默认是9090端口。
   --web.listen-address="0.0.0.0:9090" \
   # 指定Prometheus最大的连接数量,默认是512。
   --web.max-connections=8192 \
   # 能够热加载配置文件。
   --web.enable-lifecycle

ExecReload=/bin/kill -HUP $MAINPID
LimitNOFILE=65535

[Install]
WantedBy=multi-user.target
# 创建数据存储目录
[root@lb ~]# mkdir -p /data/prometheus
# 加载systemd文件
[root@lb ~]# systemctl daemon-reload
# 启动
[root@lb ~]# systemctl start prometheus-server
# 检查状态
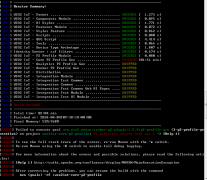
[root@lb ~/prometheus]# systemctl status prometheus-server
● prometheus-server.service - huangSir Linux Prometheus Server
Loaded: loaded (/etc/systemd/system/prometheus-server.service; disabled; vendor preset: enabled)
Active: active (running) since Mon 2025-06-02 16:23:40 CST; 3s ago
Docs: https://prometheus.io/docs/introduction/overview/
Main PID: 605022 (prometheus)
Tasks: 5 (limit: 973)
Memory: 63.8M
CPU: 125ms
CGroup: /system.slice/prometheus-server.service
└─605022 /root/prometheus/prometheus --config.file=/root/prometheus/prometheus.yml --storage.tsdb.path=/data/prometheus --log.level=warn --log.format=json --storage.tsdb.retention.time=60d --we>
Jun 02 16:23:40 lb systemd[1]: Started huangSir Linux Prometheus Server.
Jun 02 16:23:40 lb prometheus[605022]: {"time":"2025-06-02T08:23:40.635150017Z","level":"WARN","source":"main.go:689","msg":"This Prometheus binary has not been compiled for a 64-bit architecture. Due to vi>
本文来自博客园,作者:huangSir-devops,转载请注明原文链接:https://www.cnblogs.com/huangSir-devops/p/18907356,微信Vac6666666,欢迎交流

Ubuntu离线环境部署Kubernetes v1.31.3(ARM64)


 关注微信
关注微信